
Fact Sheet
Overview
Global Visibility
One source of truth for programs, trials, countries, depots, and sites. See what you have, where it is, and what is at risk in seconds.

©
The Blind Spots That Slow Portfolio Decisions
Data sits in different tools. Rollups take days. Risk is tracked ad hoc. Global Visibility gives a consistent, drillable view of status, stock, and risk, so priorities are clear.
Fragmented Reporting
Different teams publish different numbers. Meetings stall on reconciliation.
Hidden Risk
Country and depot risks live in spreadsheets, so patterns are missed.
Slow Rollups
Basic questions, such as “how many trials and where,” require manual extraction.

©
Features and Capabilities
Bring together insight, intelligence, and control to manage your clinical supply chain with precision and confidence.
Global Portfolio
Gives clinical supply leaders a unified, real-time view of all programs and trials, enabling faster, clearer, and fully informed portfolio decisions.
Portfolio Overview
Total programs and trials with counts by phase and study state. (Planned, Recruiting, Active Recruiting, Active Not Recruiting, Completed, Terminated, Suspended, Withdrawn.)
Country Coverage
Number of countries running trials with overall risk per country.
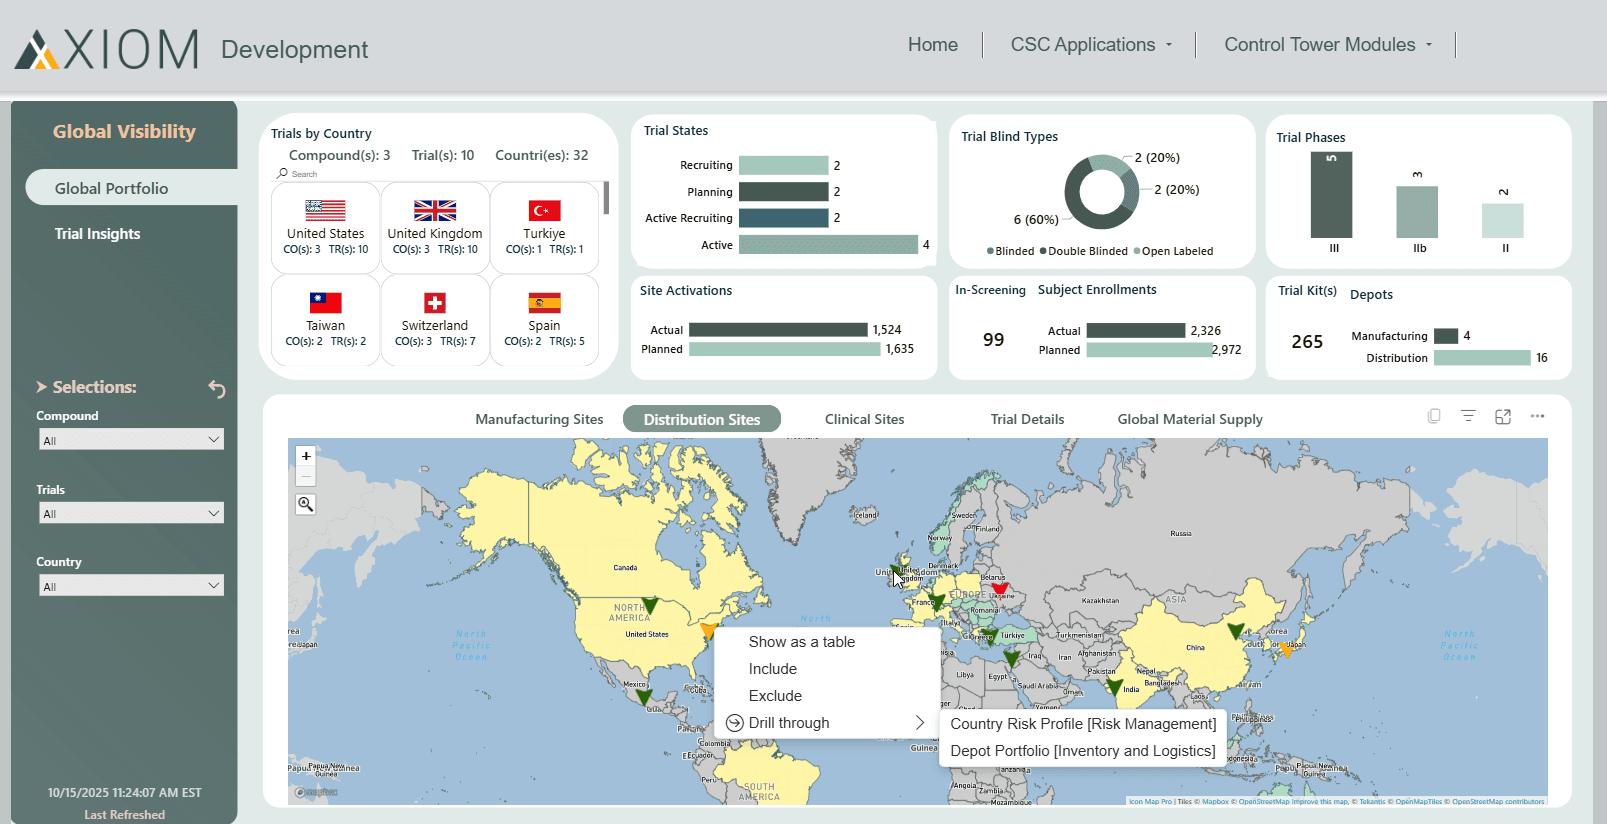
Supply Network Digital Twin
Map of manufacturing sites, distribution depots, and investigational sites with risk scores.
Health Signals
At-a-glance portfolio health indicators that link to drilldowns.
©
©
Country Portfolio
Provides a clear view of trial activity, demand, and inventory by country so teams can manage risk and respond to local changes in real time.
Country Trial List
All compounds and trials are run in a country, organized by phase and state.
Planned vs Actual Sites
Compare planned site activations to actuals by region and country.
Planned vs Actual Enrollment
Track enrollment progress for each trial within the country.
Node View
Manufacturing and distribution depots support the trial within a country with status and risk.
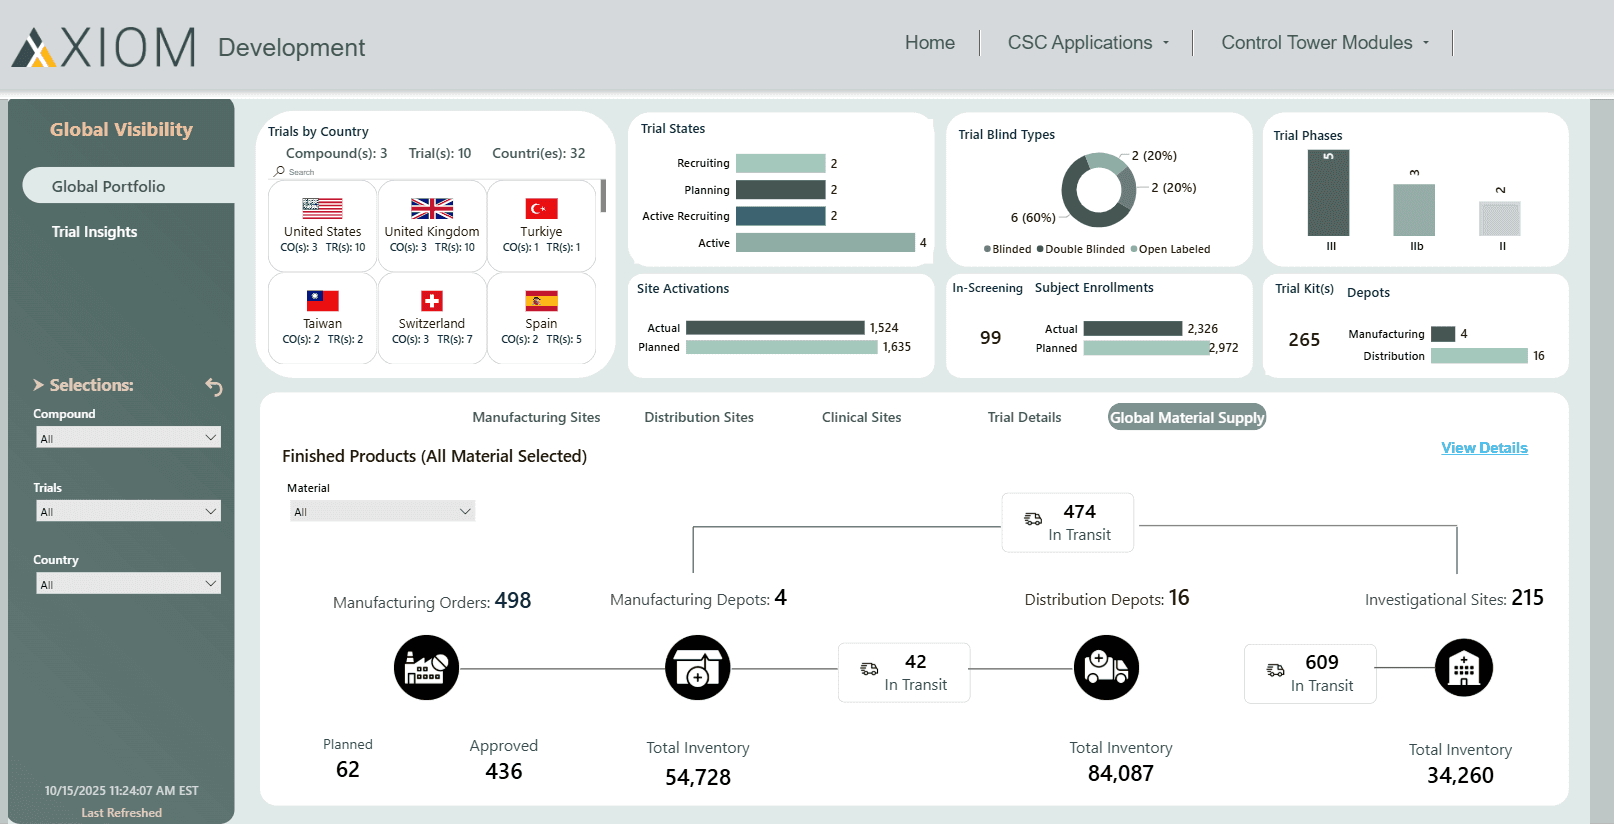
Trial Insights
Provides 360-degree visibility into site inventory, shipments, enrollment, and upcoming visits to ensure that the right drug is always available at the right site while minimizing waste.
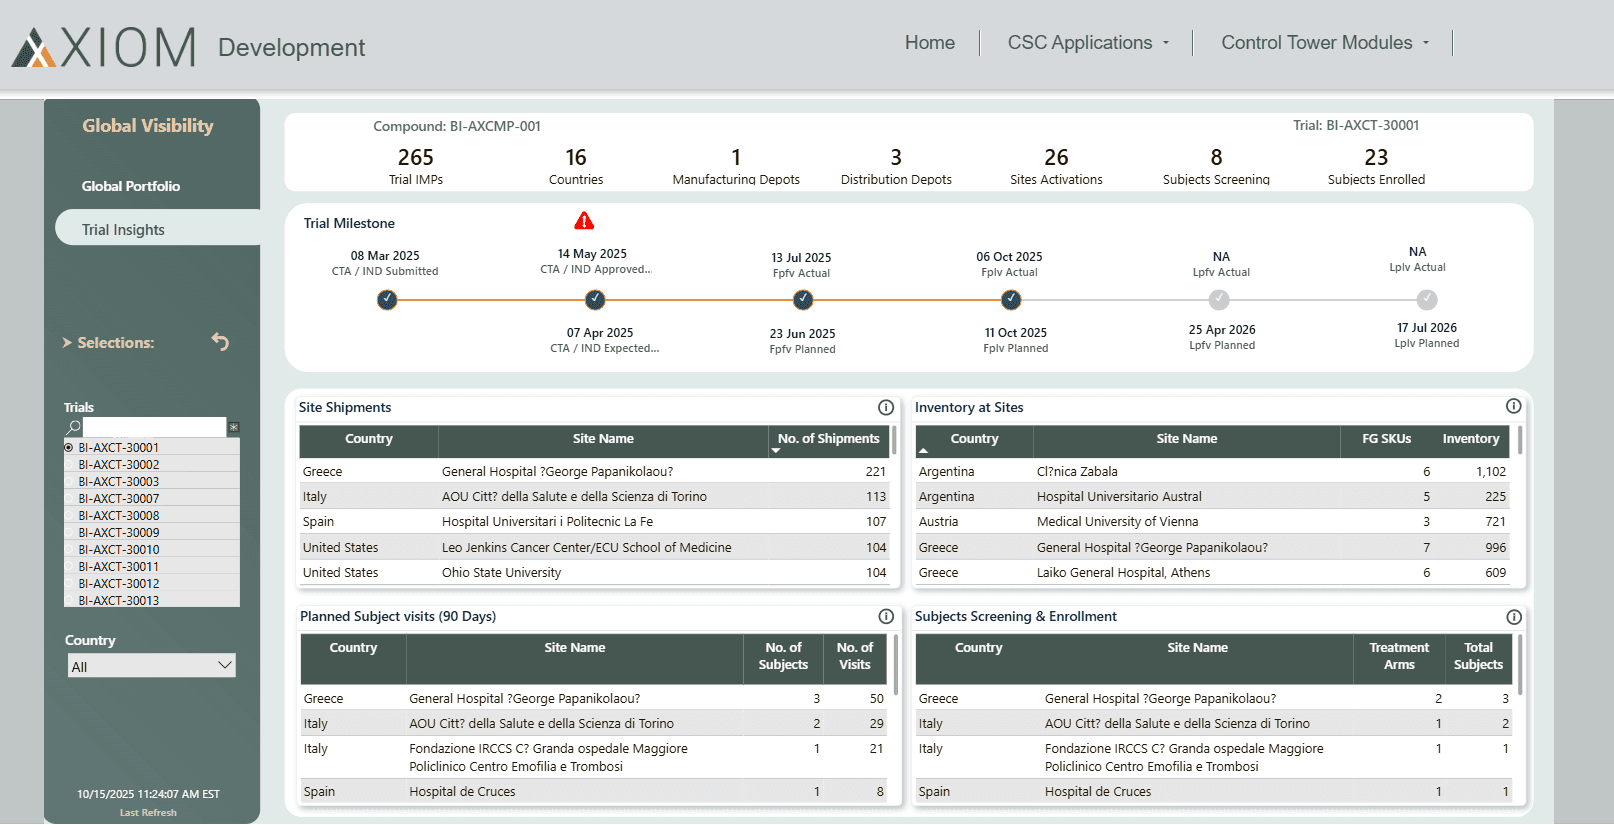
Trial Rollup
Summary across all countries, or drill into one country or site.
Milestones View
Planned and actual trial milestones with on-time or delayed status.
Subject Enrollment View
Enrollment by study, country, and site, allowing planners to react early.
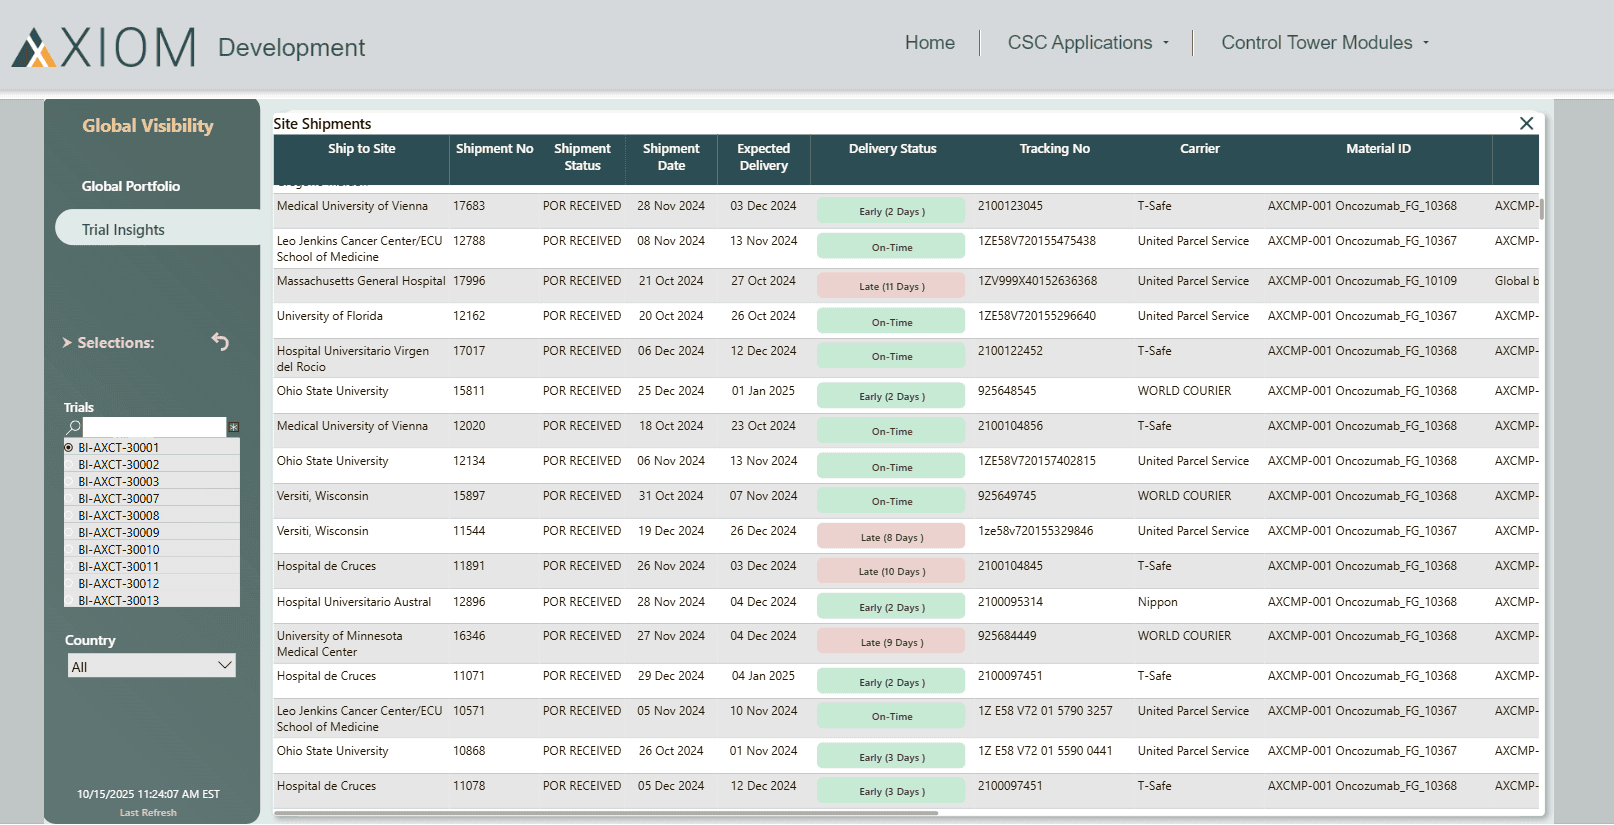
Inventory at Site
On-hand stock, inbound shipments, and lots nearing expiry.
Visit Planning
Planned patient visits by site to align supply with demand.
©
©
Applied
Shows how AI and automation turn raw supply data into practical tools that help teams predict risk, improve planning, and reduce waste.
Applied Intelligence
Turns raw operational data into clear, actionable insights that drive better supply decisions at every stage, across every trial and region.
Applied Automation
Eliminates manual tracking and reporting, so supply teams can focus on what matters: strategic planning and solving real problems as they arise.
Applied Analytics
Constantly scans portfolio, country, and depot data to spot risks early—so you can act before enrollment or delivery is ever at risk.
Applied Collaboration
Brings leadership, planners, and operations together in a single view, so everyone moves forward with the same real-time information and no surprises.
Who uses it
Built for every level of the clinical supply organization, aligning leadership, planning, and operations through a shared real-time view of performance and risk.


©
Business Outcomes
Achieve proactive control over your global supply chain with fewer surprises, faster decisions, and consistent delivery to every patient site.
Fewer Disruptions
Anticipate and neutralize risks before they threaten trial timelines or patient supply.
Smarter Forecasting
Sharpen forecasting accuracy by connecting real-time performance data directly to demand signals.
Greater Efficiency
Cut waste, rein in costs, and direct resources to the areas with the greatest impact.
Stronger Alignment
Bring leadership, planning, and operations into alignment with shared visibility and clear accountability.
Take Action
Learn how Boston Insights equips you to anticipate risk, act faster, and keep patients on schedule.
Fact Sheet